This covers how to track, visualize, and compare model predictions over the course of training, using PyTorch on MNIST data. You will learn how to:Documentation Index
Fetch the complete documentation index at: https://translations.mintlify.app/llms.txt
Use this file to discover all available pages before exploring further.
- Log metrics, images, text, etc. to a
wandb.Table()during model training or evaluation - View, sort, filter, group, join, interactively query, and explore these tables
- Compare model predictions or results: dynamically across specific images, hyperparameters/model versions, or time steps.
Examples
Compare predicted scores for specific images
Live example: compare predictions after 1 vs 5 epochs of training →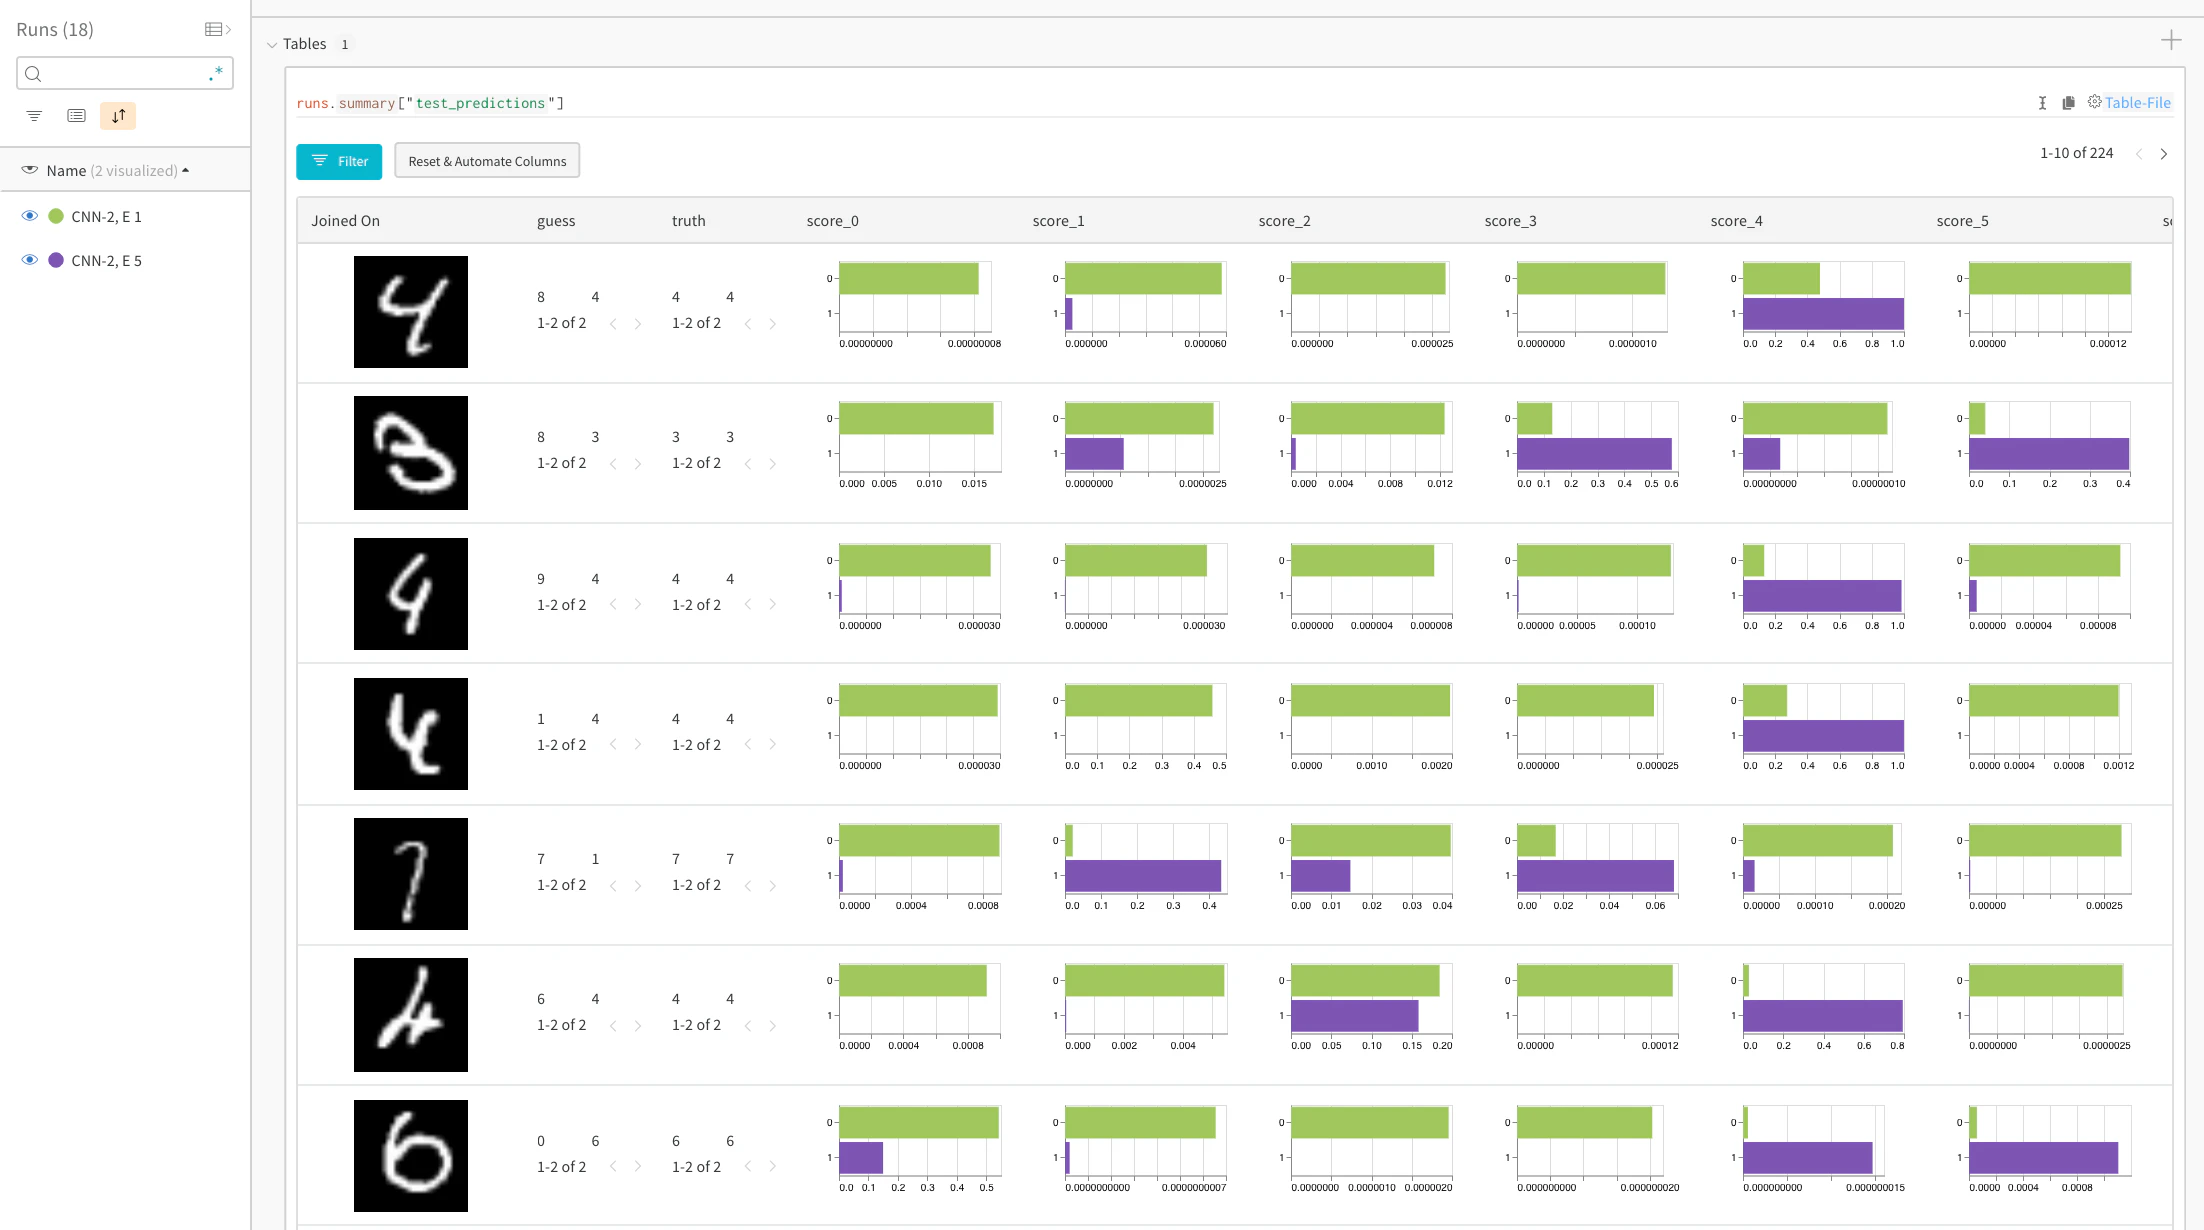
Focus on top errors over time
Live example → See incorrect predictions (filter to rows where “guess” != “truth”) on the full test data. Note that there are 229 wrong guesses after 1 training epoch, but only 98 after 5 epochs.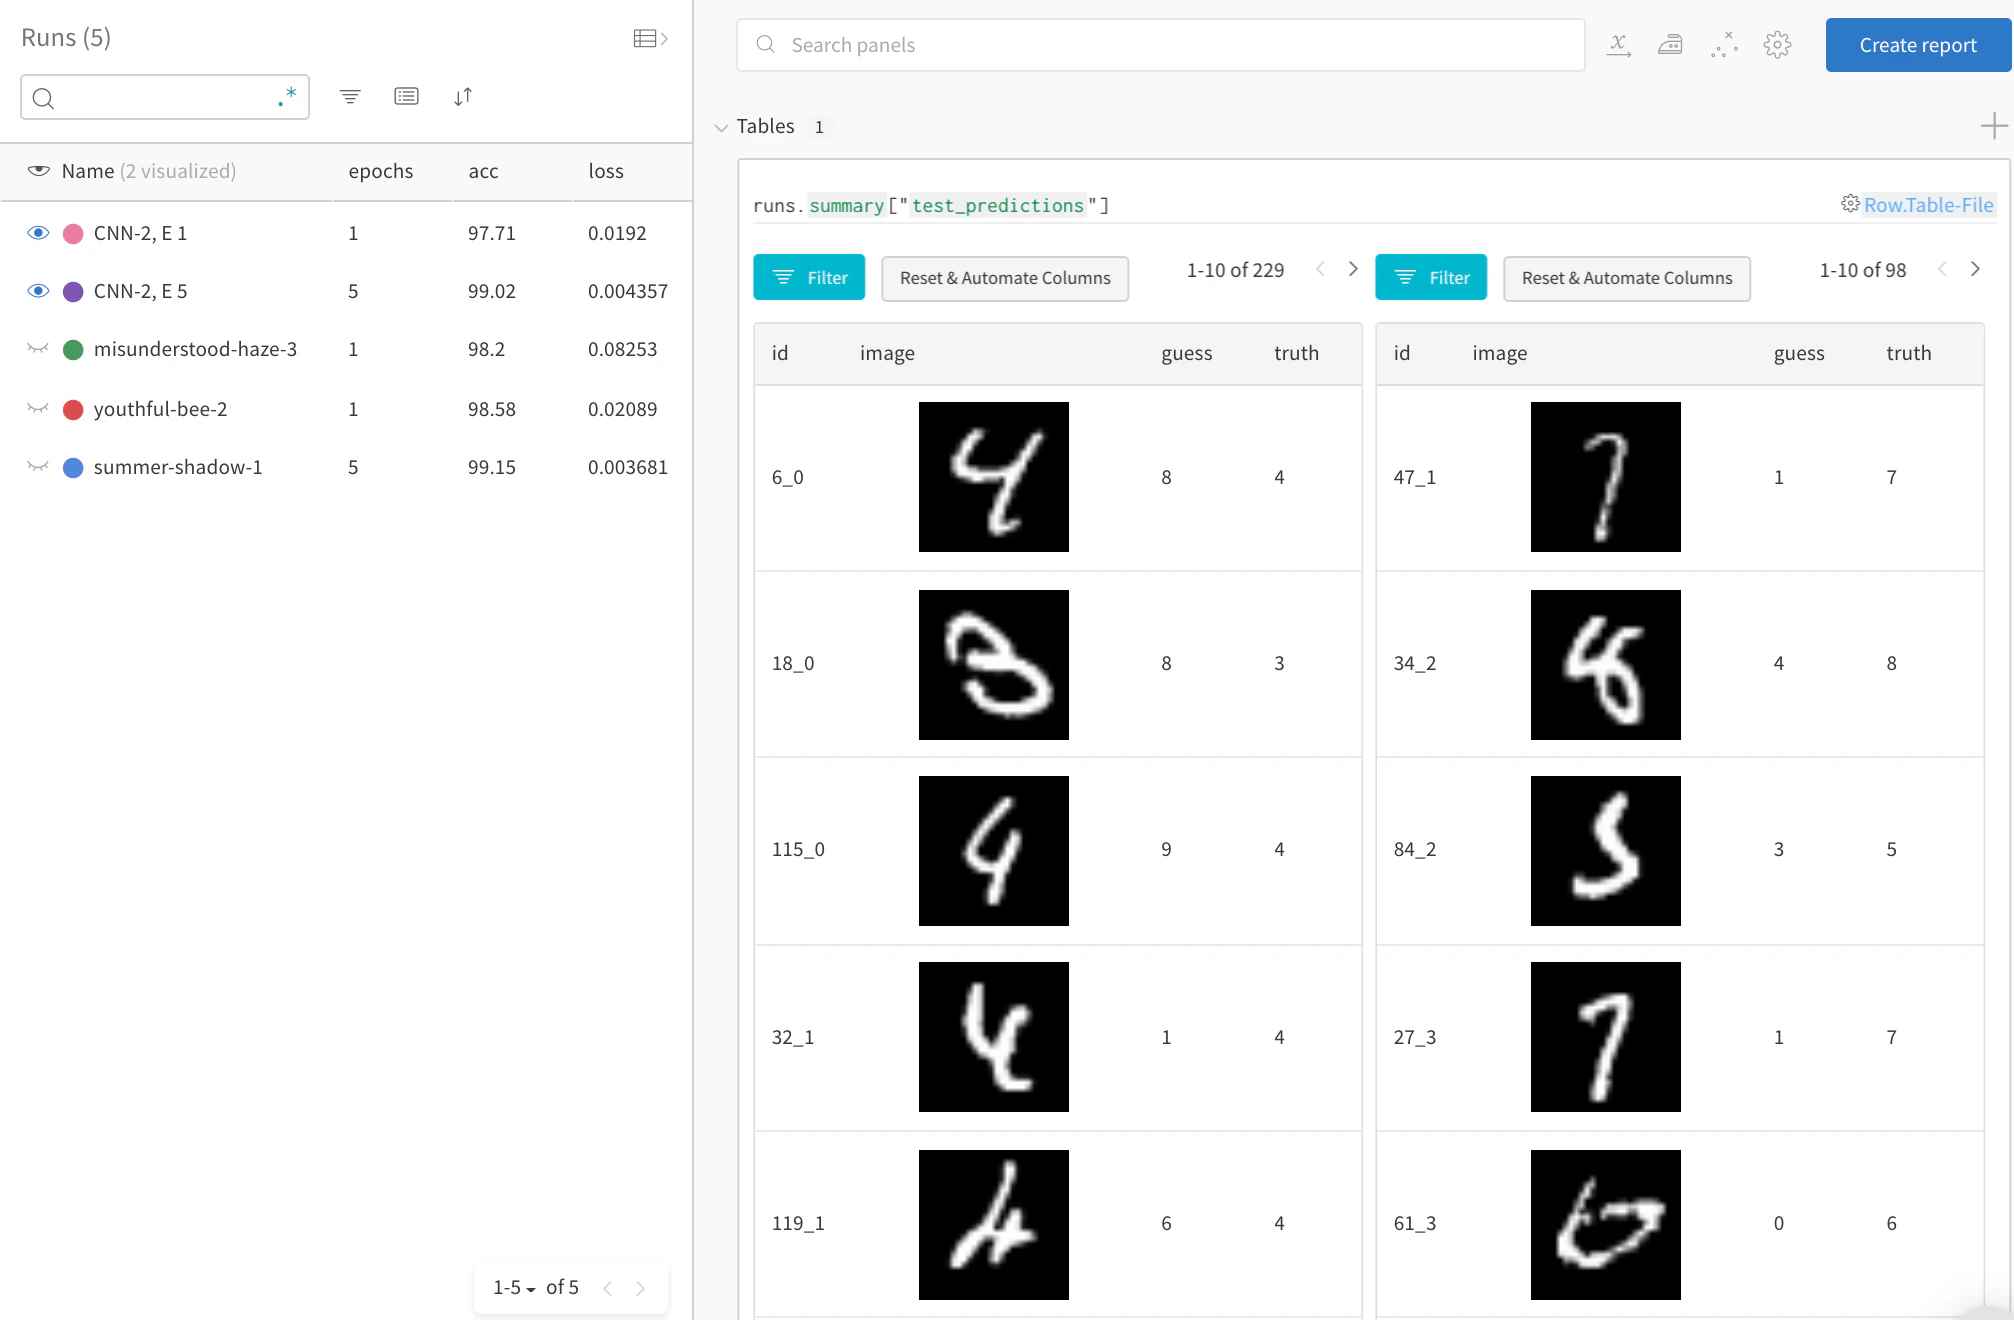
Compare model performance and find patterns
See full detail in a live example → Filter out correct answers, then group by the guess to see examples of misclassified images and the underlying distribution of true labels—for two models side-by-side. A model variant with 2X the layer sizes and learning rate is on the left, and the baseline is on the right. Note that the baseline makes slightly more mistakes for each guessed class.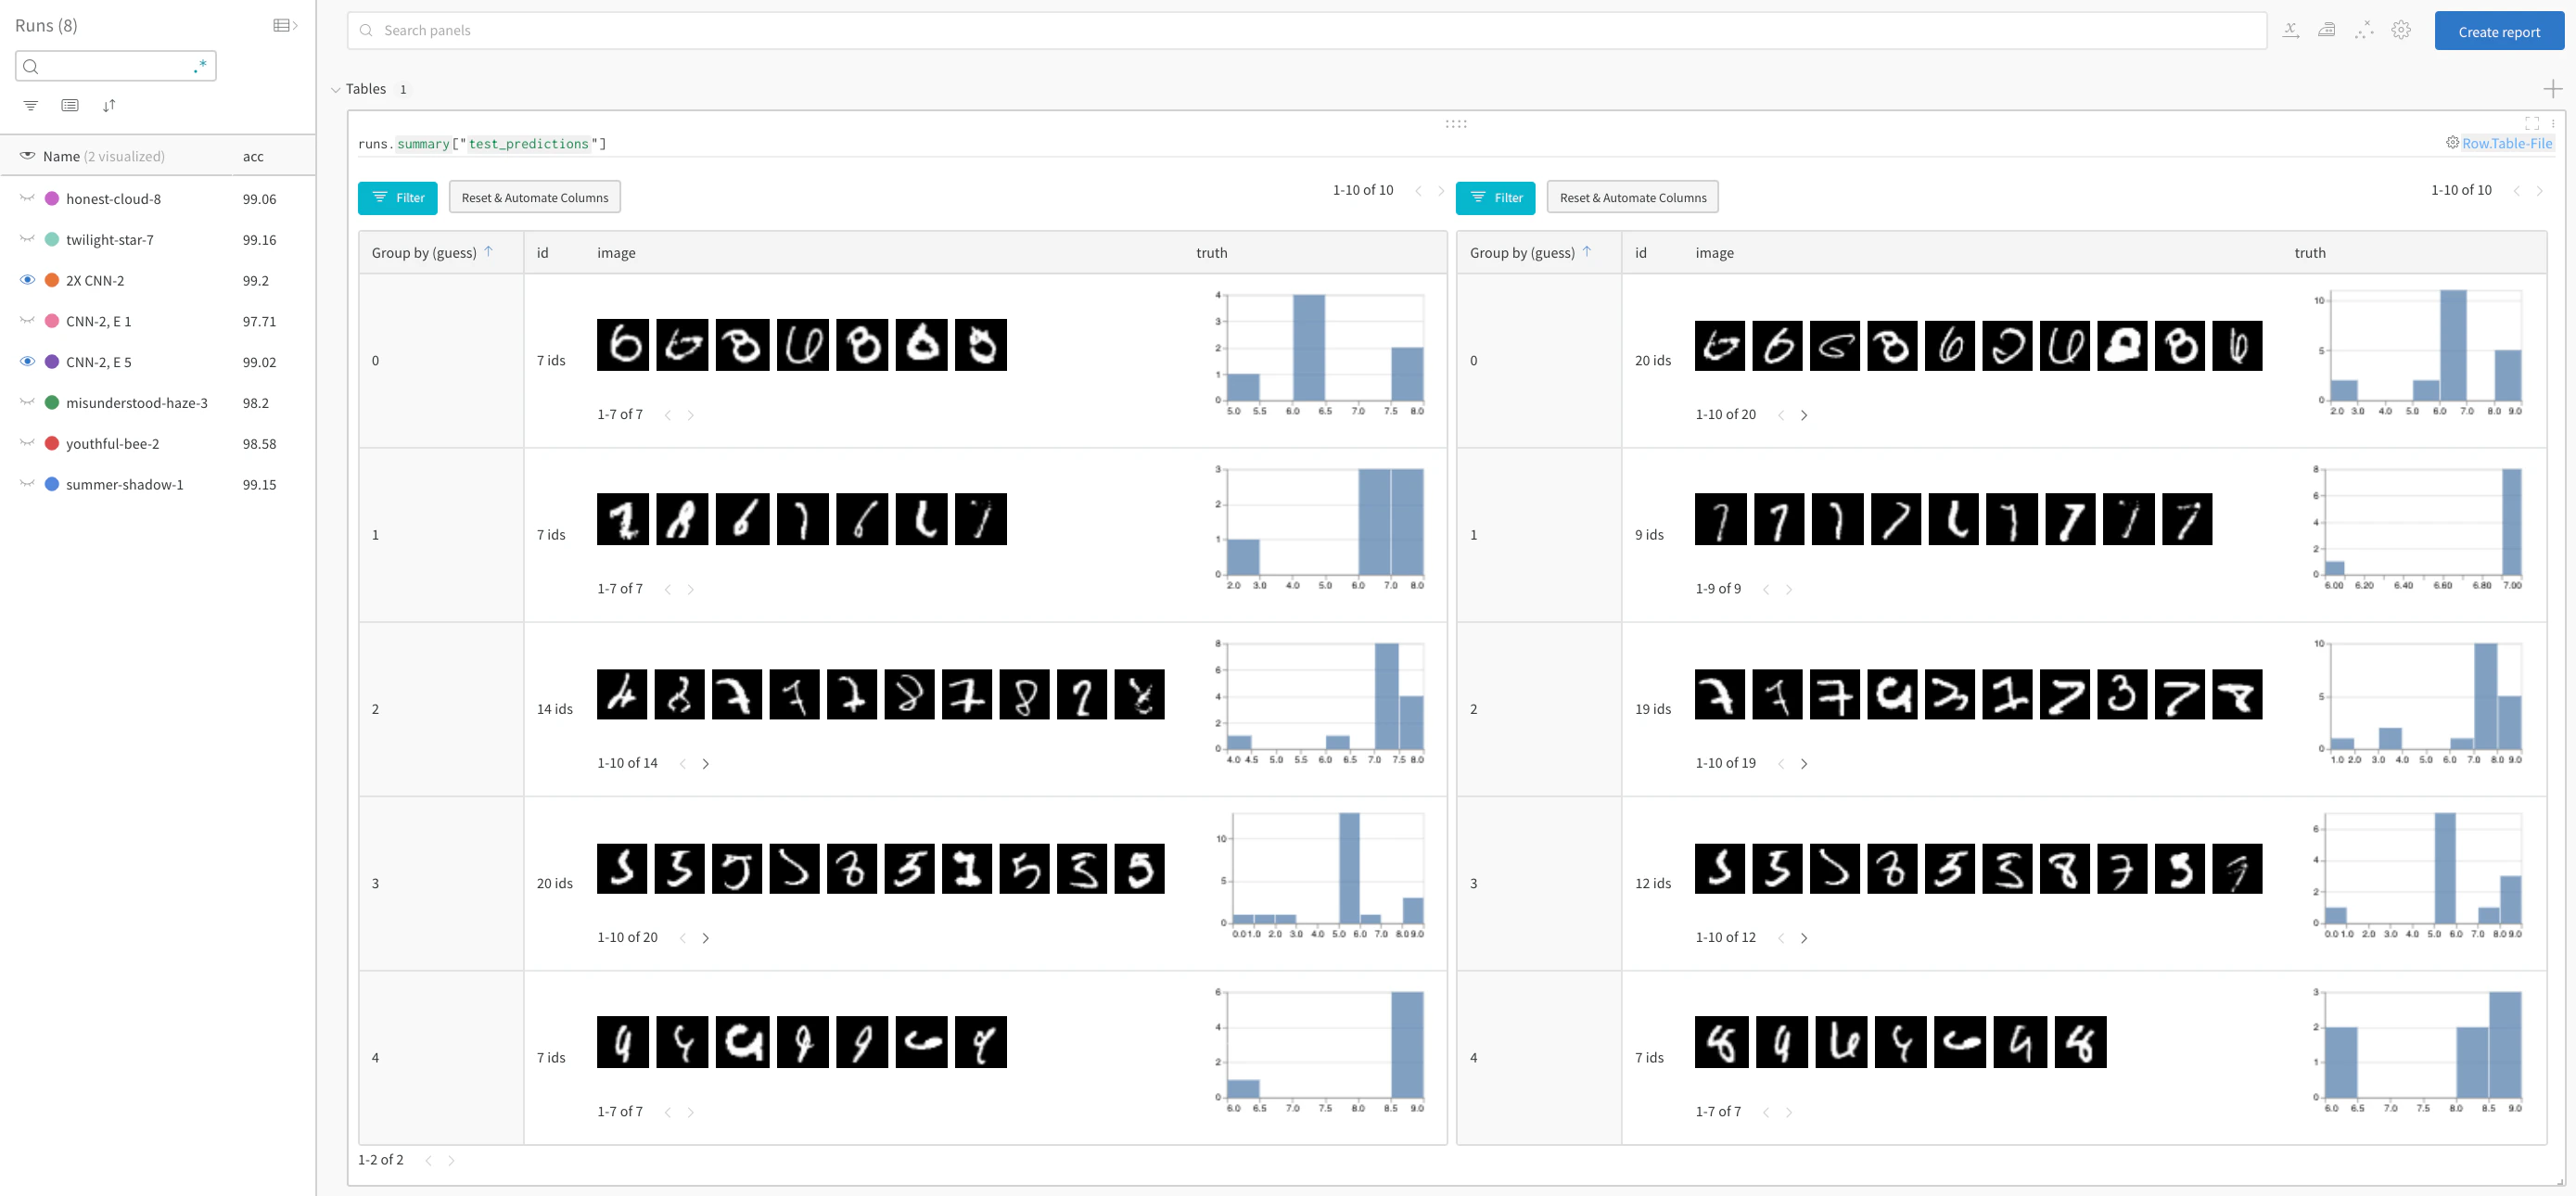
Sign up or login
Sign up or login to W&B to see and interact with your experiments in the browser. In this example we’re using Google Colab as a convenient hosted environment, but you can run your own training scripts from anywhere and visualize metrics with W&B’s experiment tracking tool.0. Setup
Install dependencies, download MNIST, and create train and test datasets using PyTorch.1. Define the model and training schedule
- Set the number of epochs to run, where each epoch consists of a training step and a validation (test) step. Optionally configure the amount of data to log per test step. Here the number of batches and number of images per batch to visualize are set low to simplify the demo.
- Define a simple convolutional neural net (following pytorch-tutorial code).
- Load in train and test sets using PyTorch
2. Run training and log test predictions
For every epoch, run a training step and a test step. For each test step, create awandb.Table() in which to store test predictions. These can be visualized, dynamically queried, and compared side by side in your browser.